
Eric Hakmiller Consulting
ABOUT
With 35+ years in commodity processing, I’ve led operations in corn wet milling, oilseed/softseed crush, soy concentrates, animal feed, and biofuels. I’ve run P&Ls, built international sales channels, and supervised plants in the U.S. and Europe. Data has always been the driver in the commodity world.
My approach is simple: make assets more efficient and more competitive in a tough commodity world.
Laplace’s Demon - If (a person) knew all the forces and the position of all things and if it were vast enough to analyze this data, then nothing would be uncertain and the future, just as the past, would present before the eyes
-Pierre-Simon Laplace 1814
All data is from publicly available sources including websites, state air permits, state construction permits, and Federal EPA filings.
US Ethanol Technology & Logistics
Here is a map of the US Ethanol industry. The map has 204 ethanol sites. Here is an interactive link to the map <here>.
There are filters on the left that allow the industry to be seen by the original technology (ICM, Delta -T, etc.), Enhanced technology or rail lines. Location, technology and rail access are the main drivers of value in the industry.
The bottom left has a counter which counts the participants of the filtered group and added the installed ethanol capacity of the group.
The top right is a menu to map major infrastructure of the industry, either rail or pipelines.
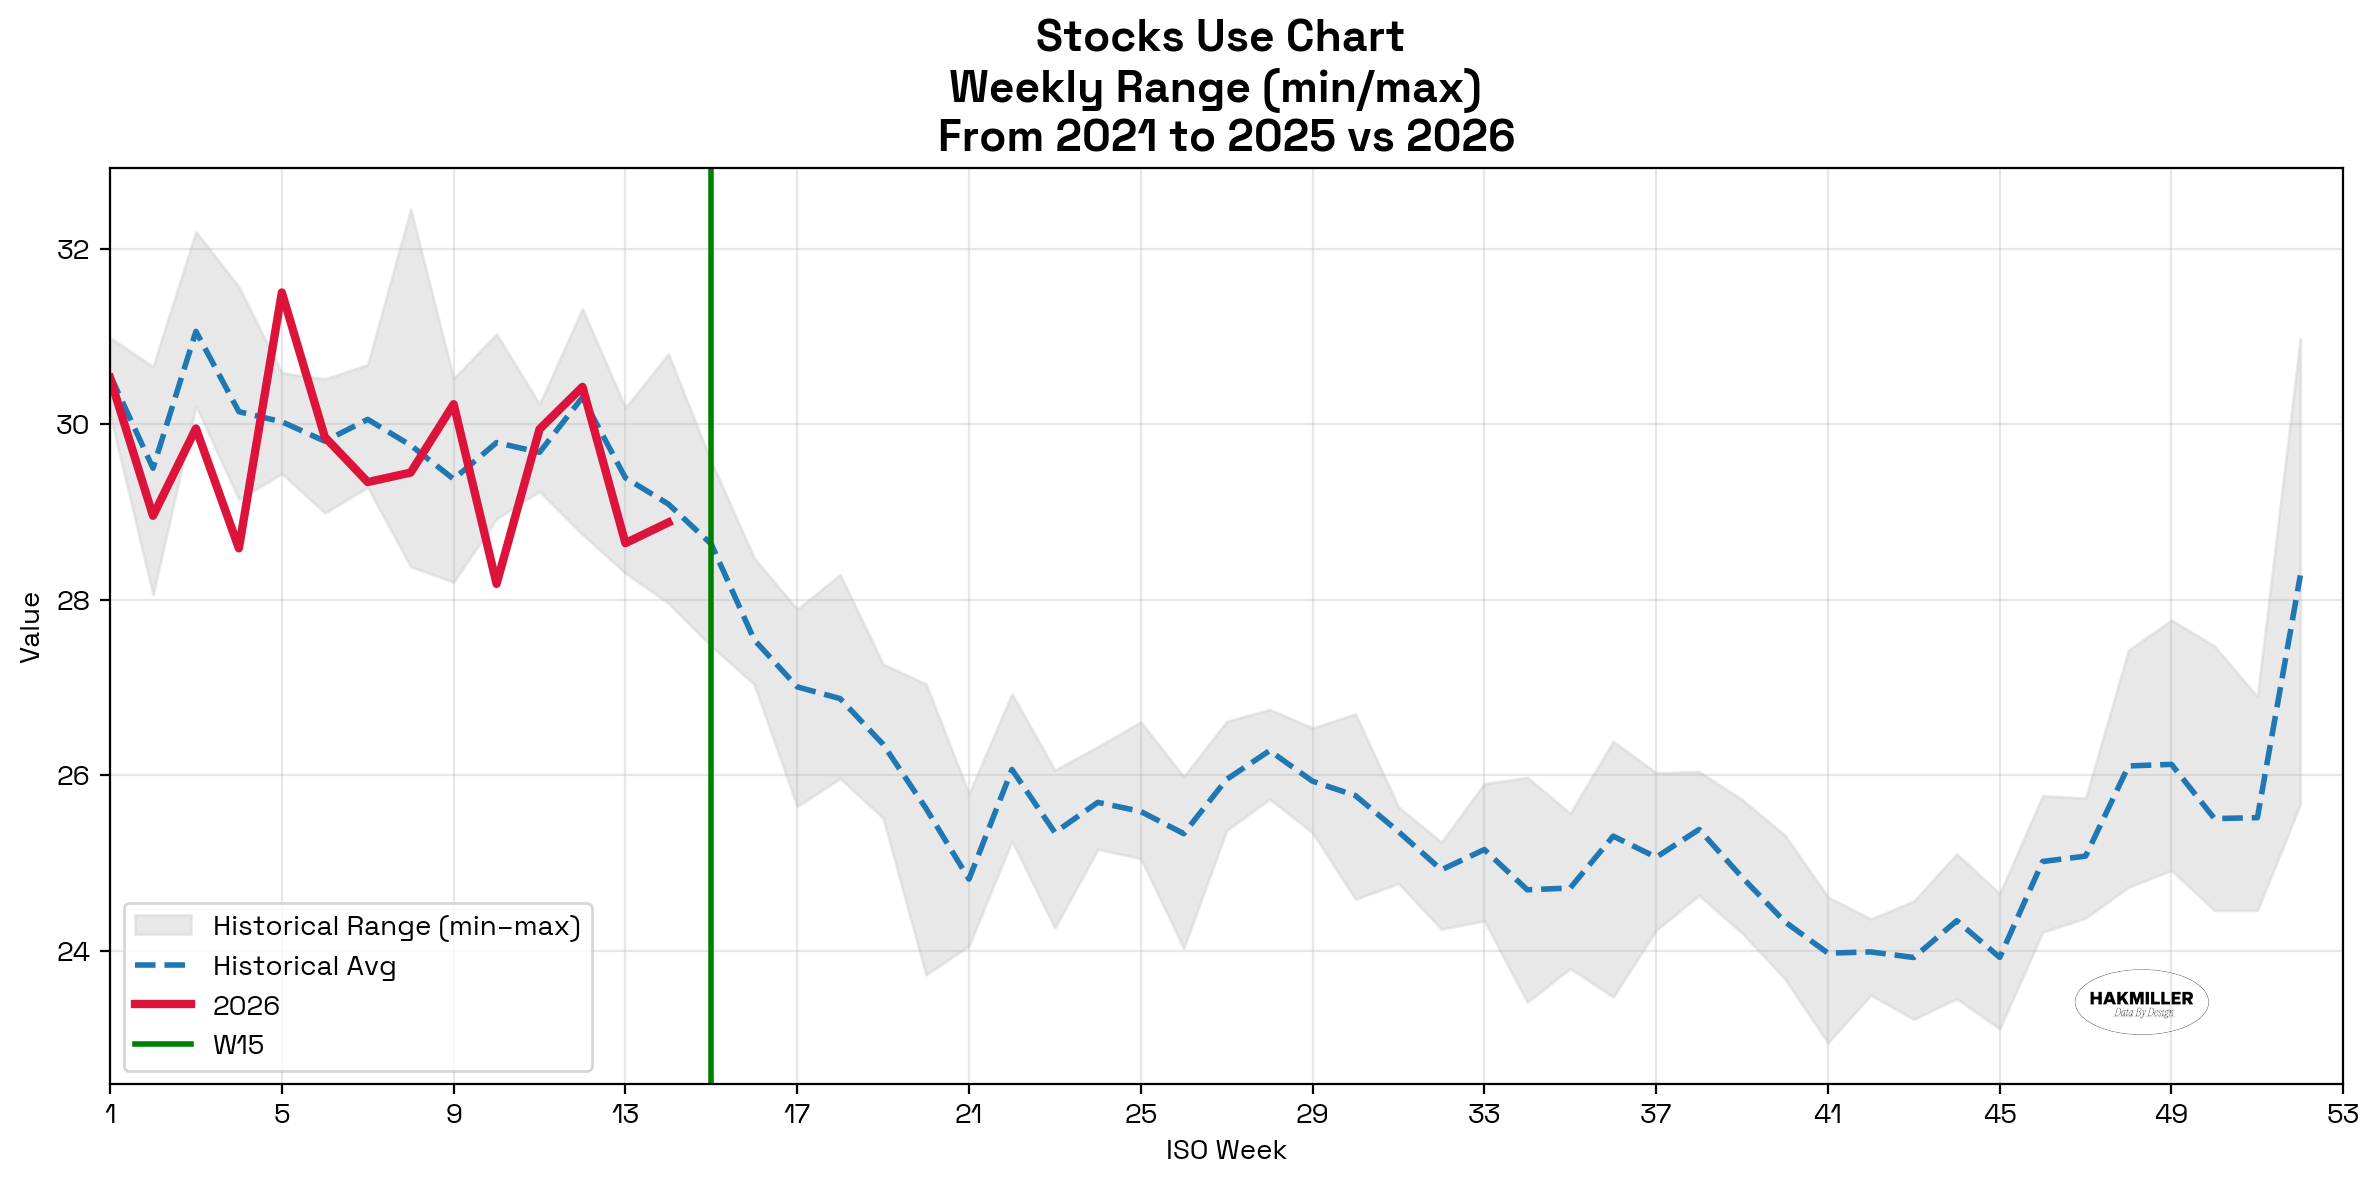
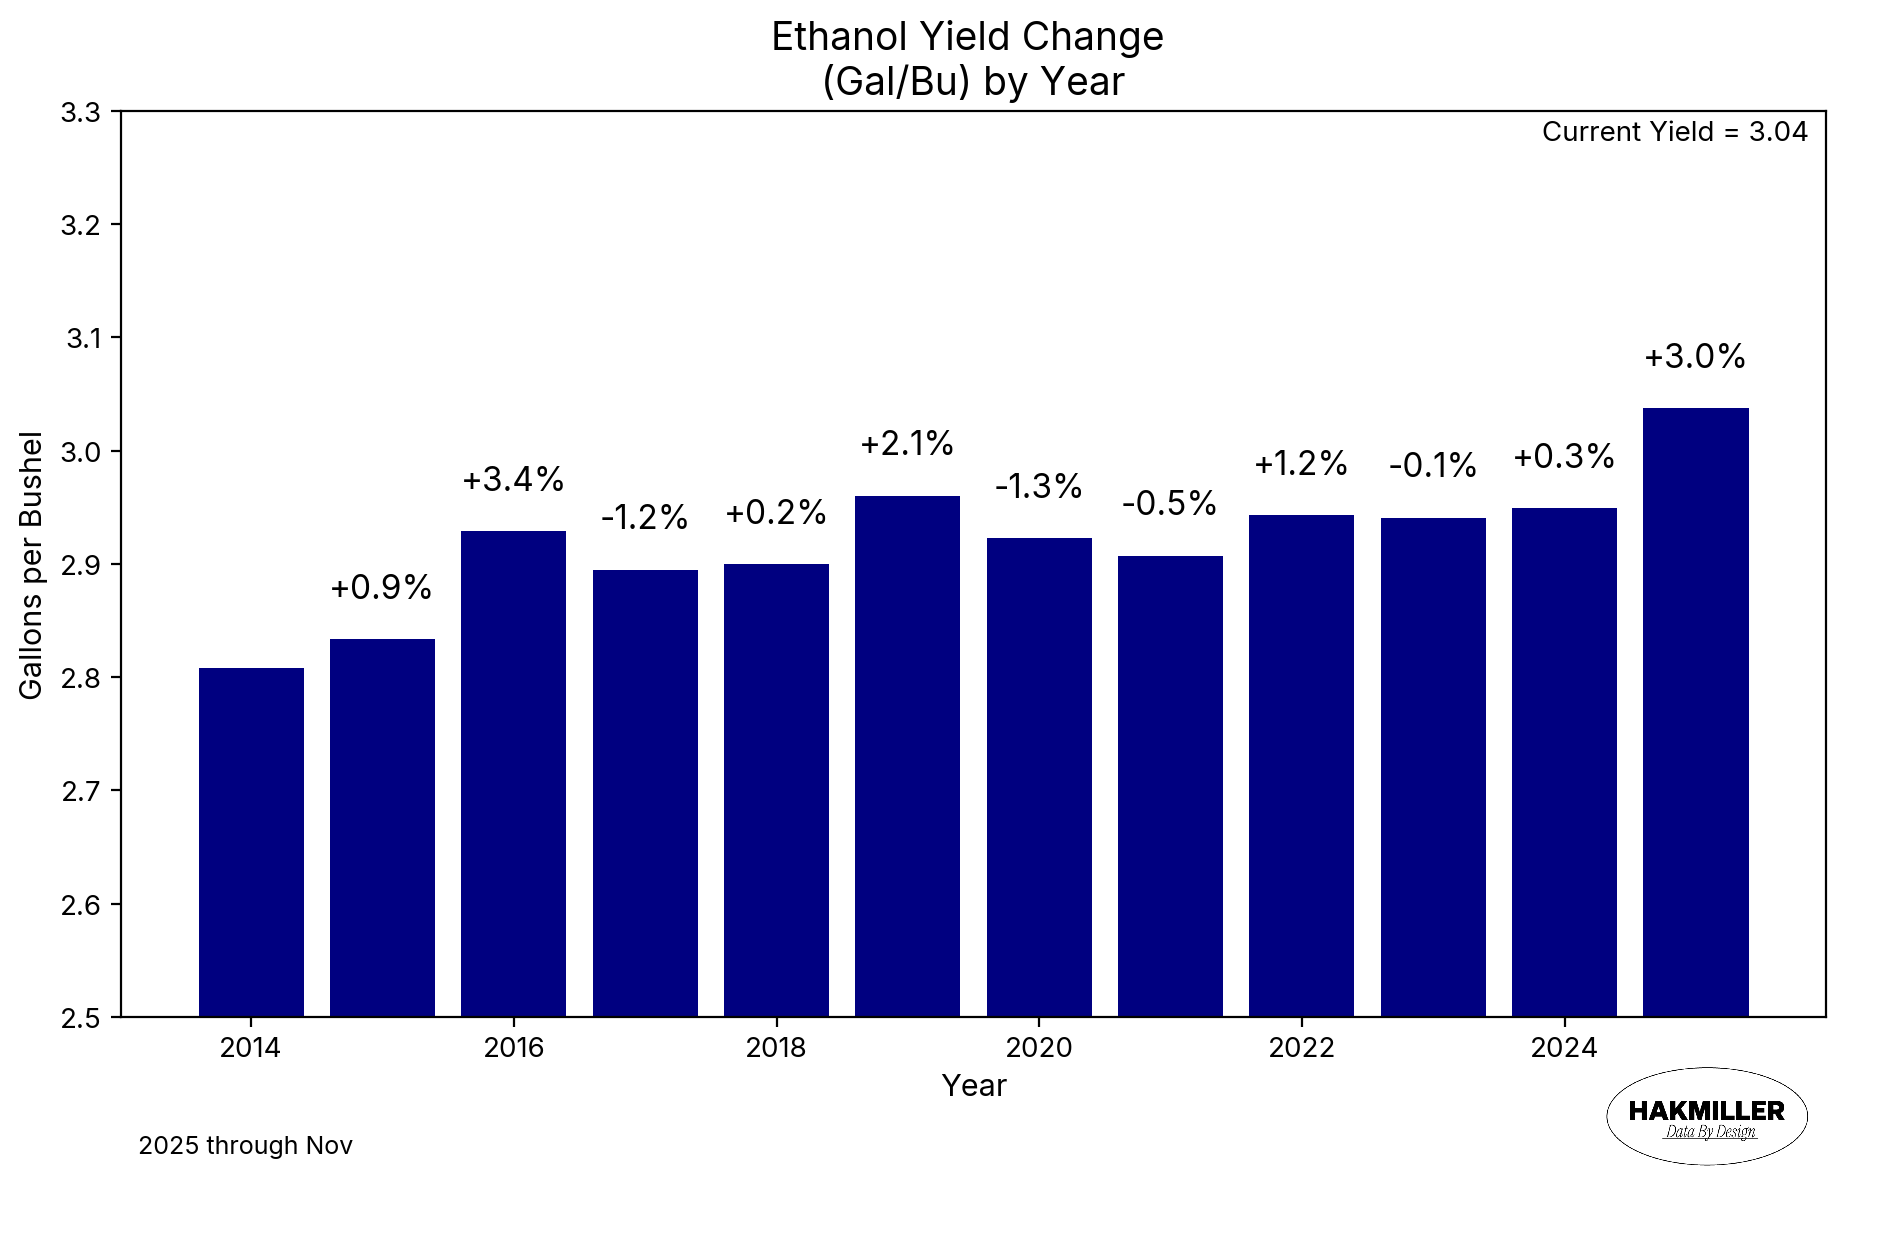
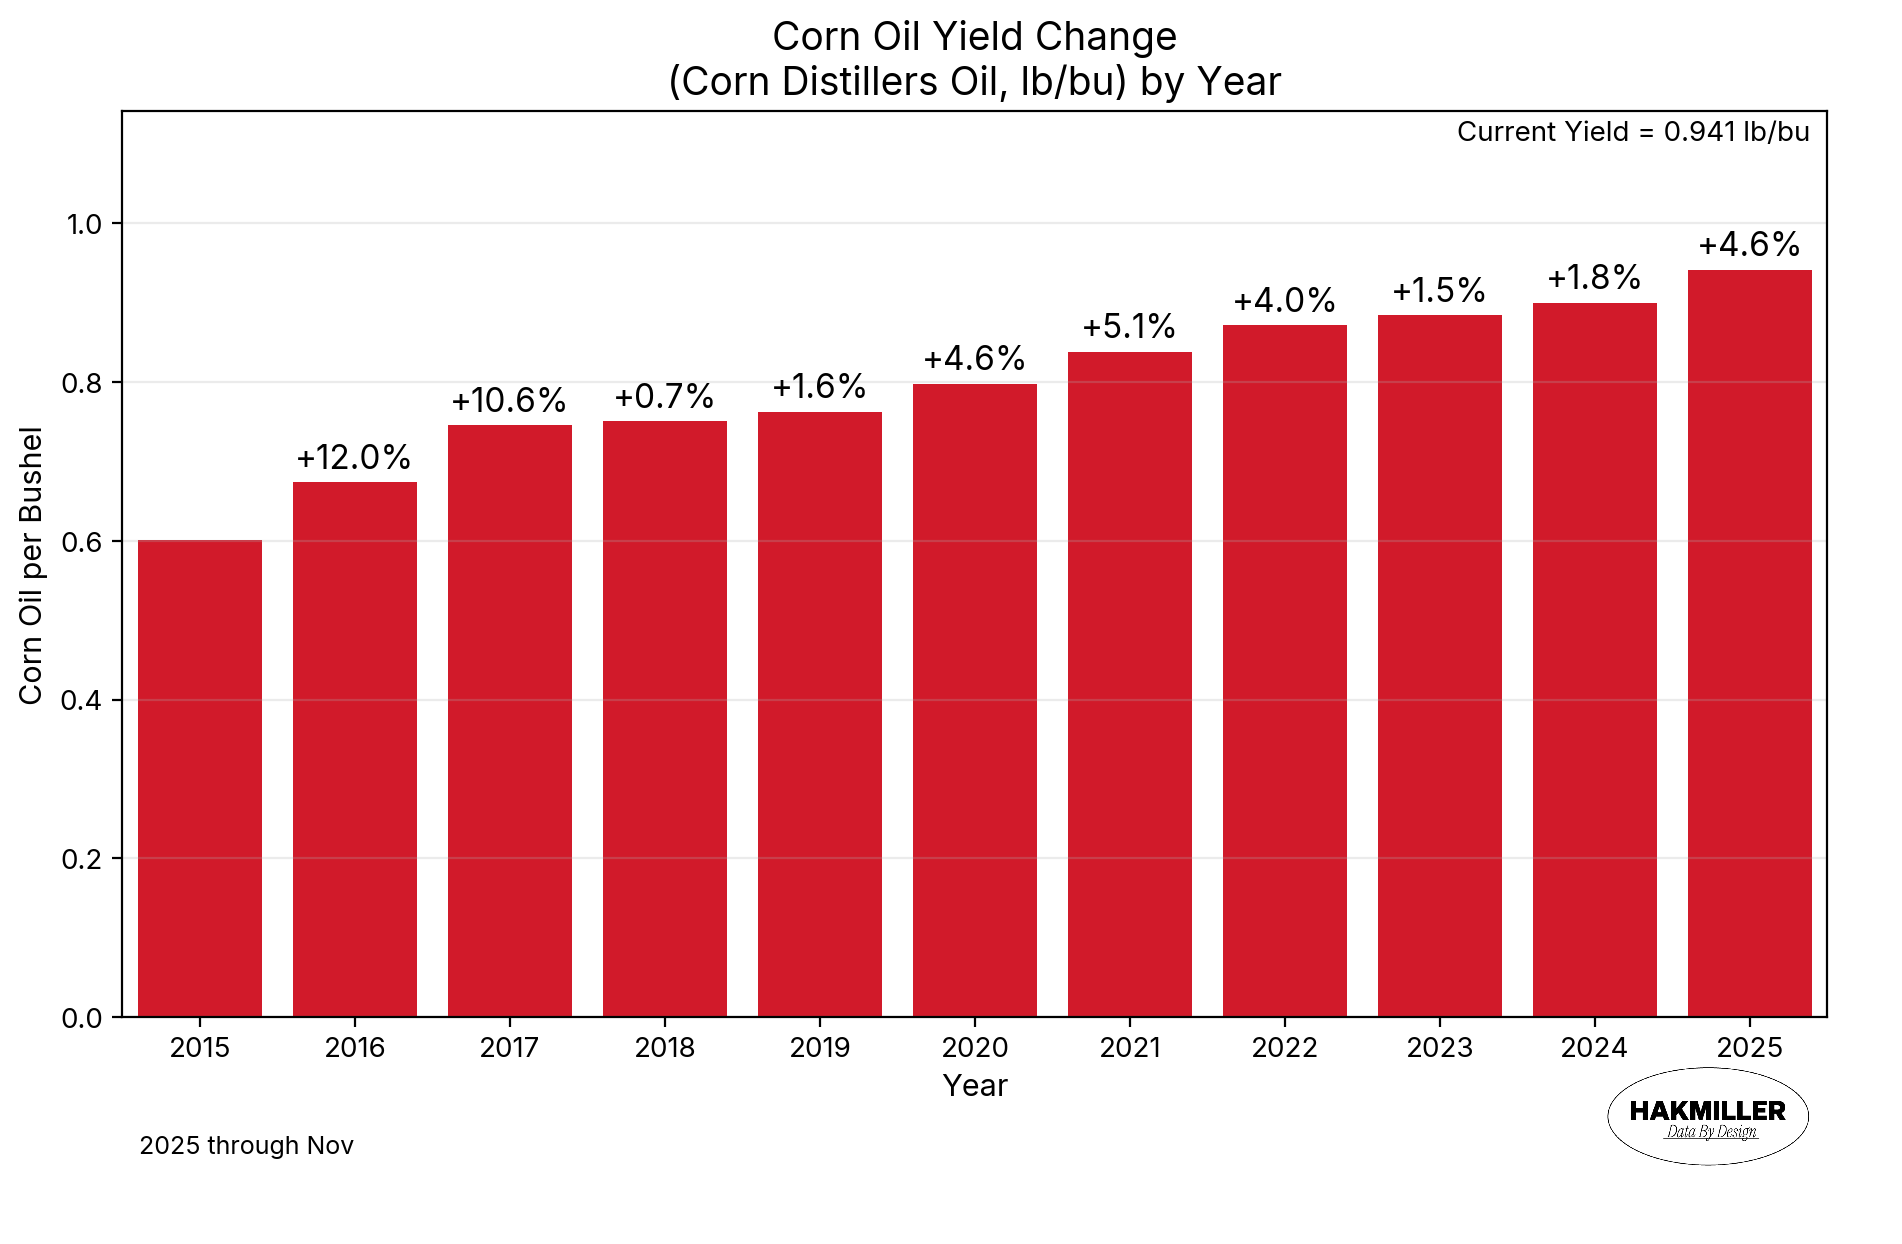
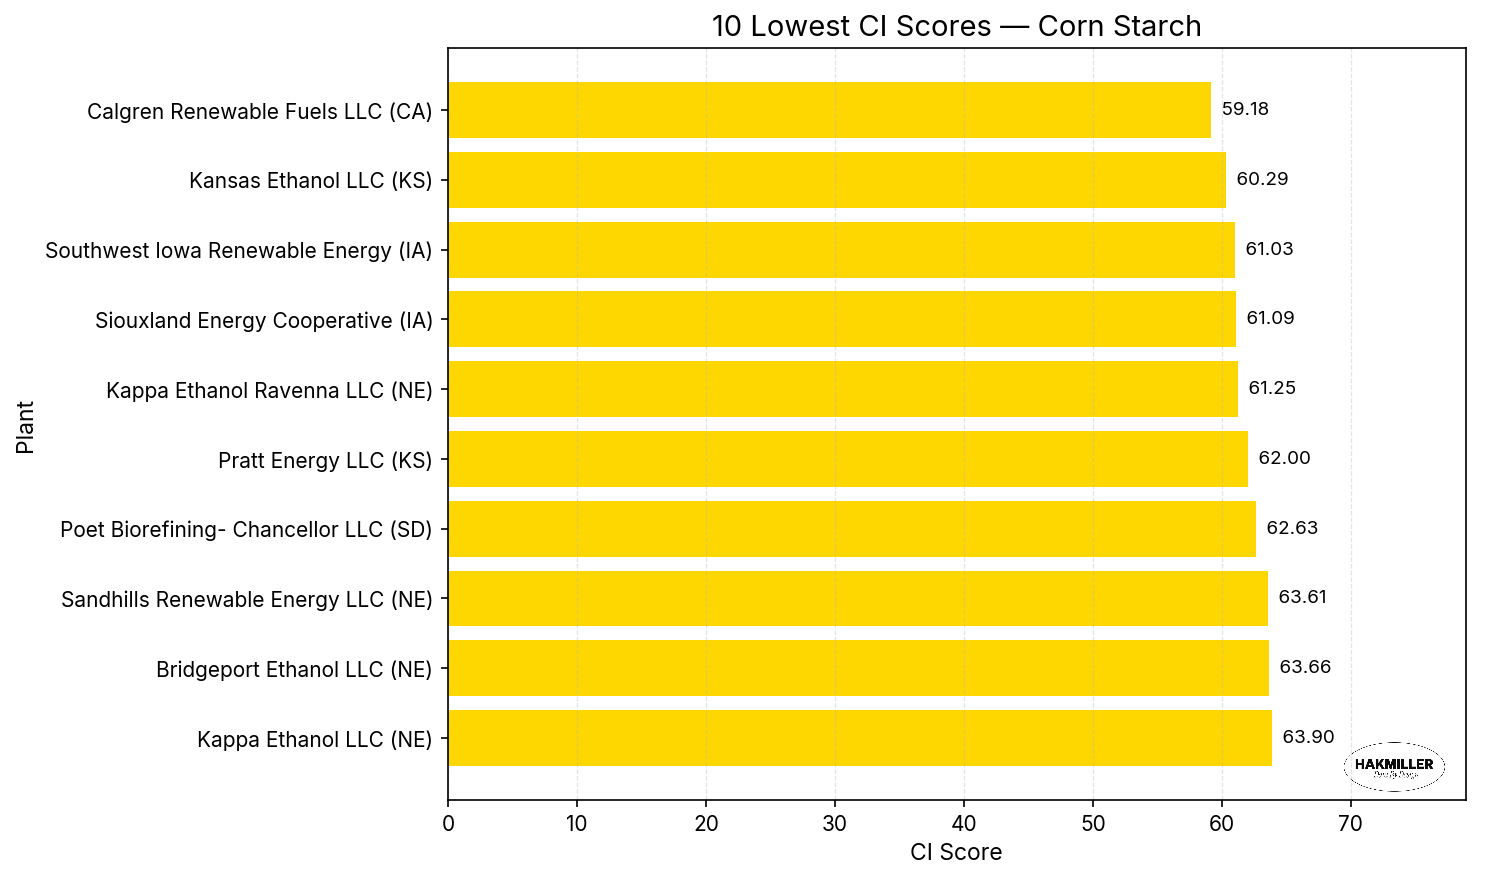
Ethanol and Corn related information:
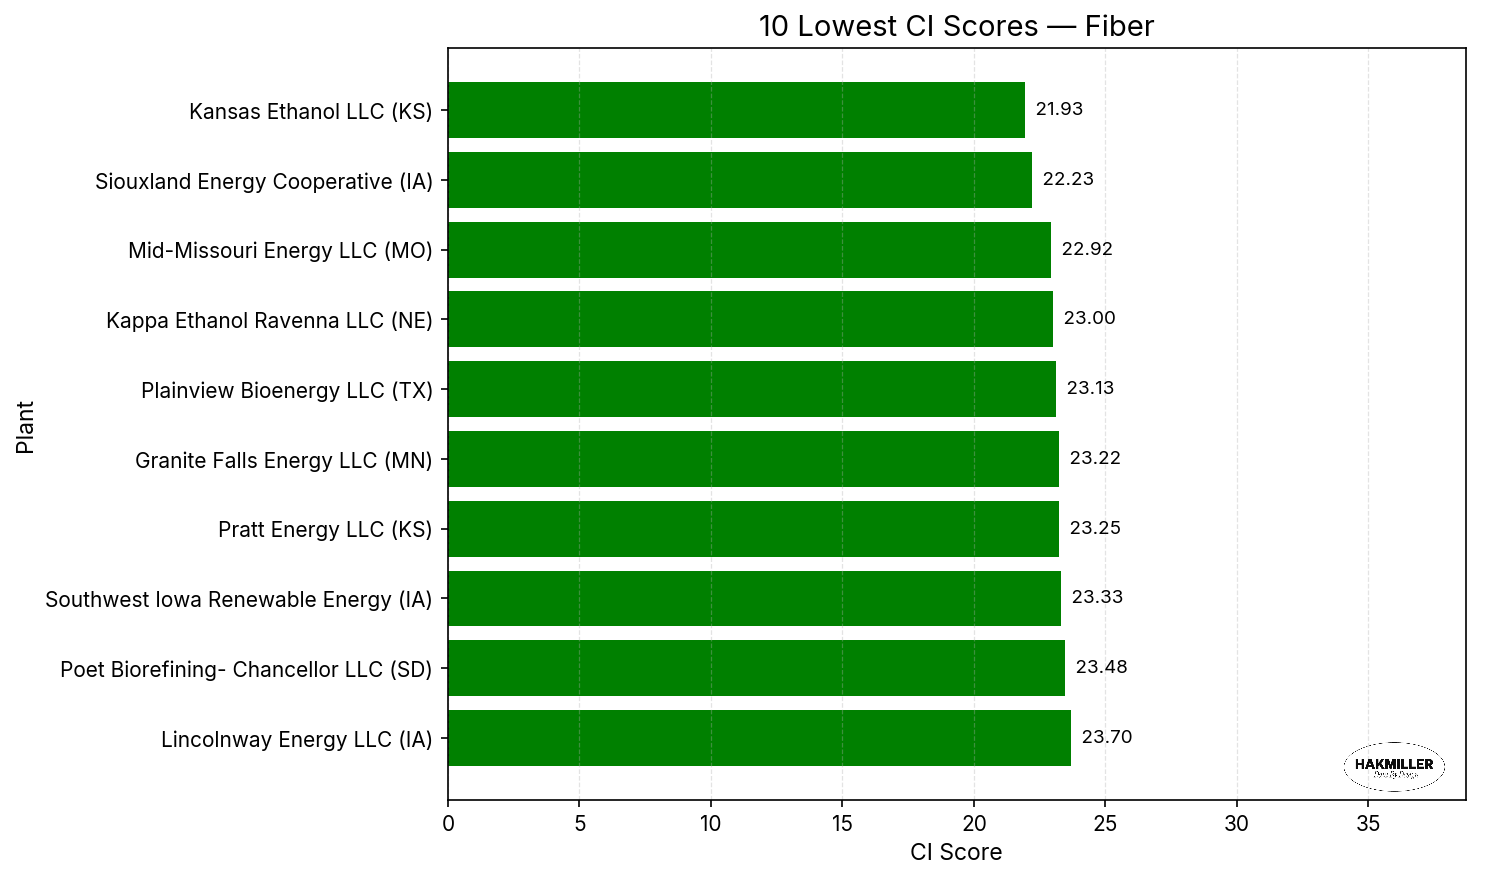
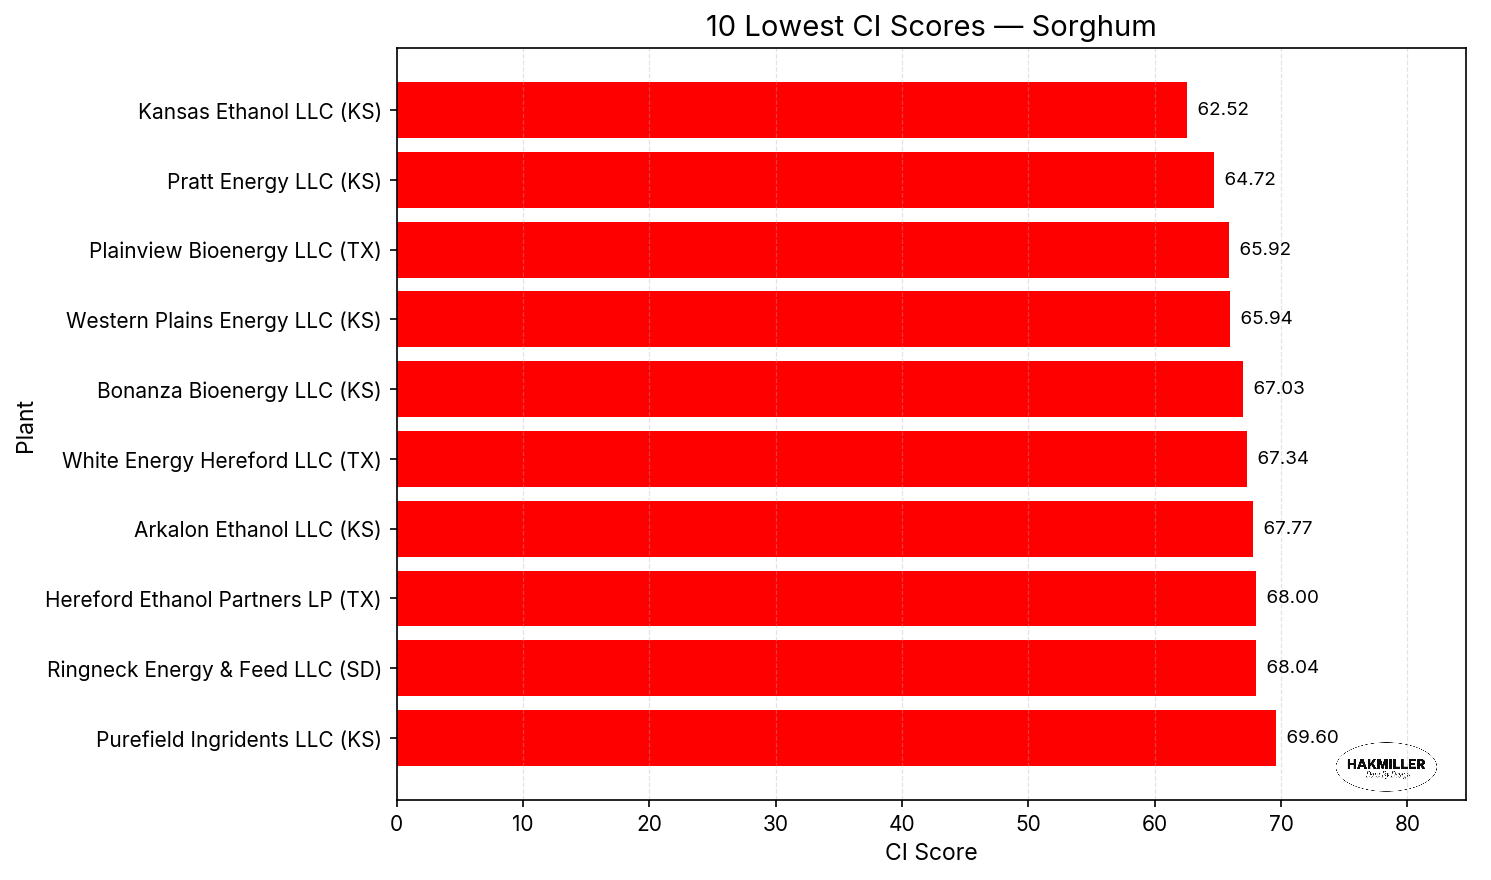
Data has never been more freely available. Aggregating that data into information and visualizing it in an actionable way is more difficult. Here are some of my favorite ethanol visualizations pulled from public information but often hard to find. You need a different look? Contact me and I see if I can pull it from my database. here>
-
-
-
-
-
New Interactive Basis Display <here>
Nearby Corn Basis Map <here>
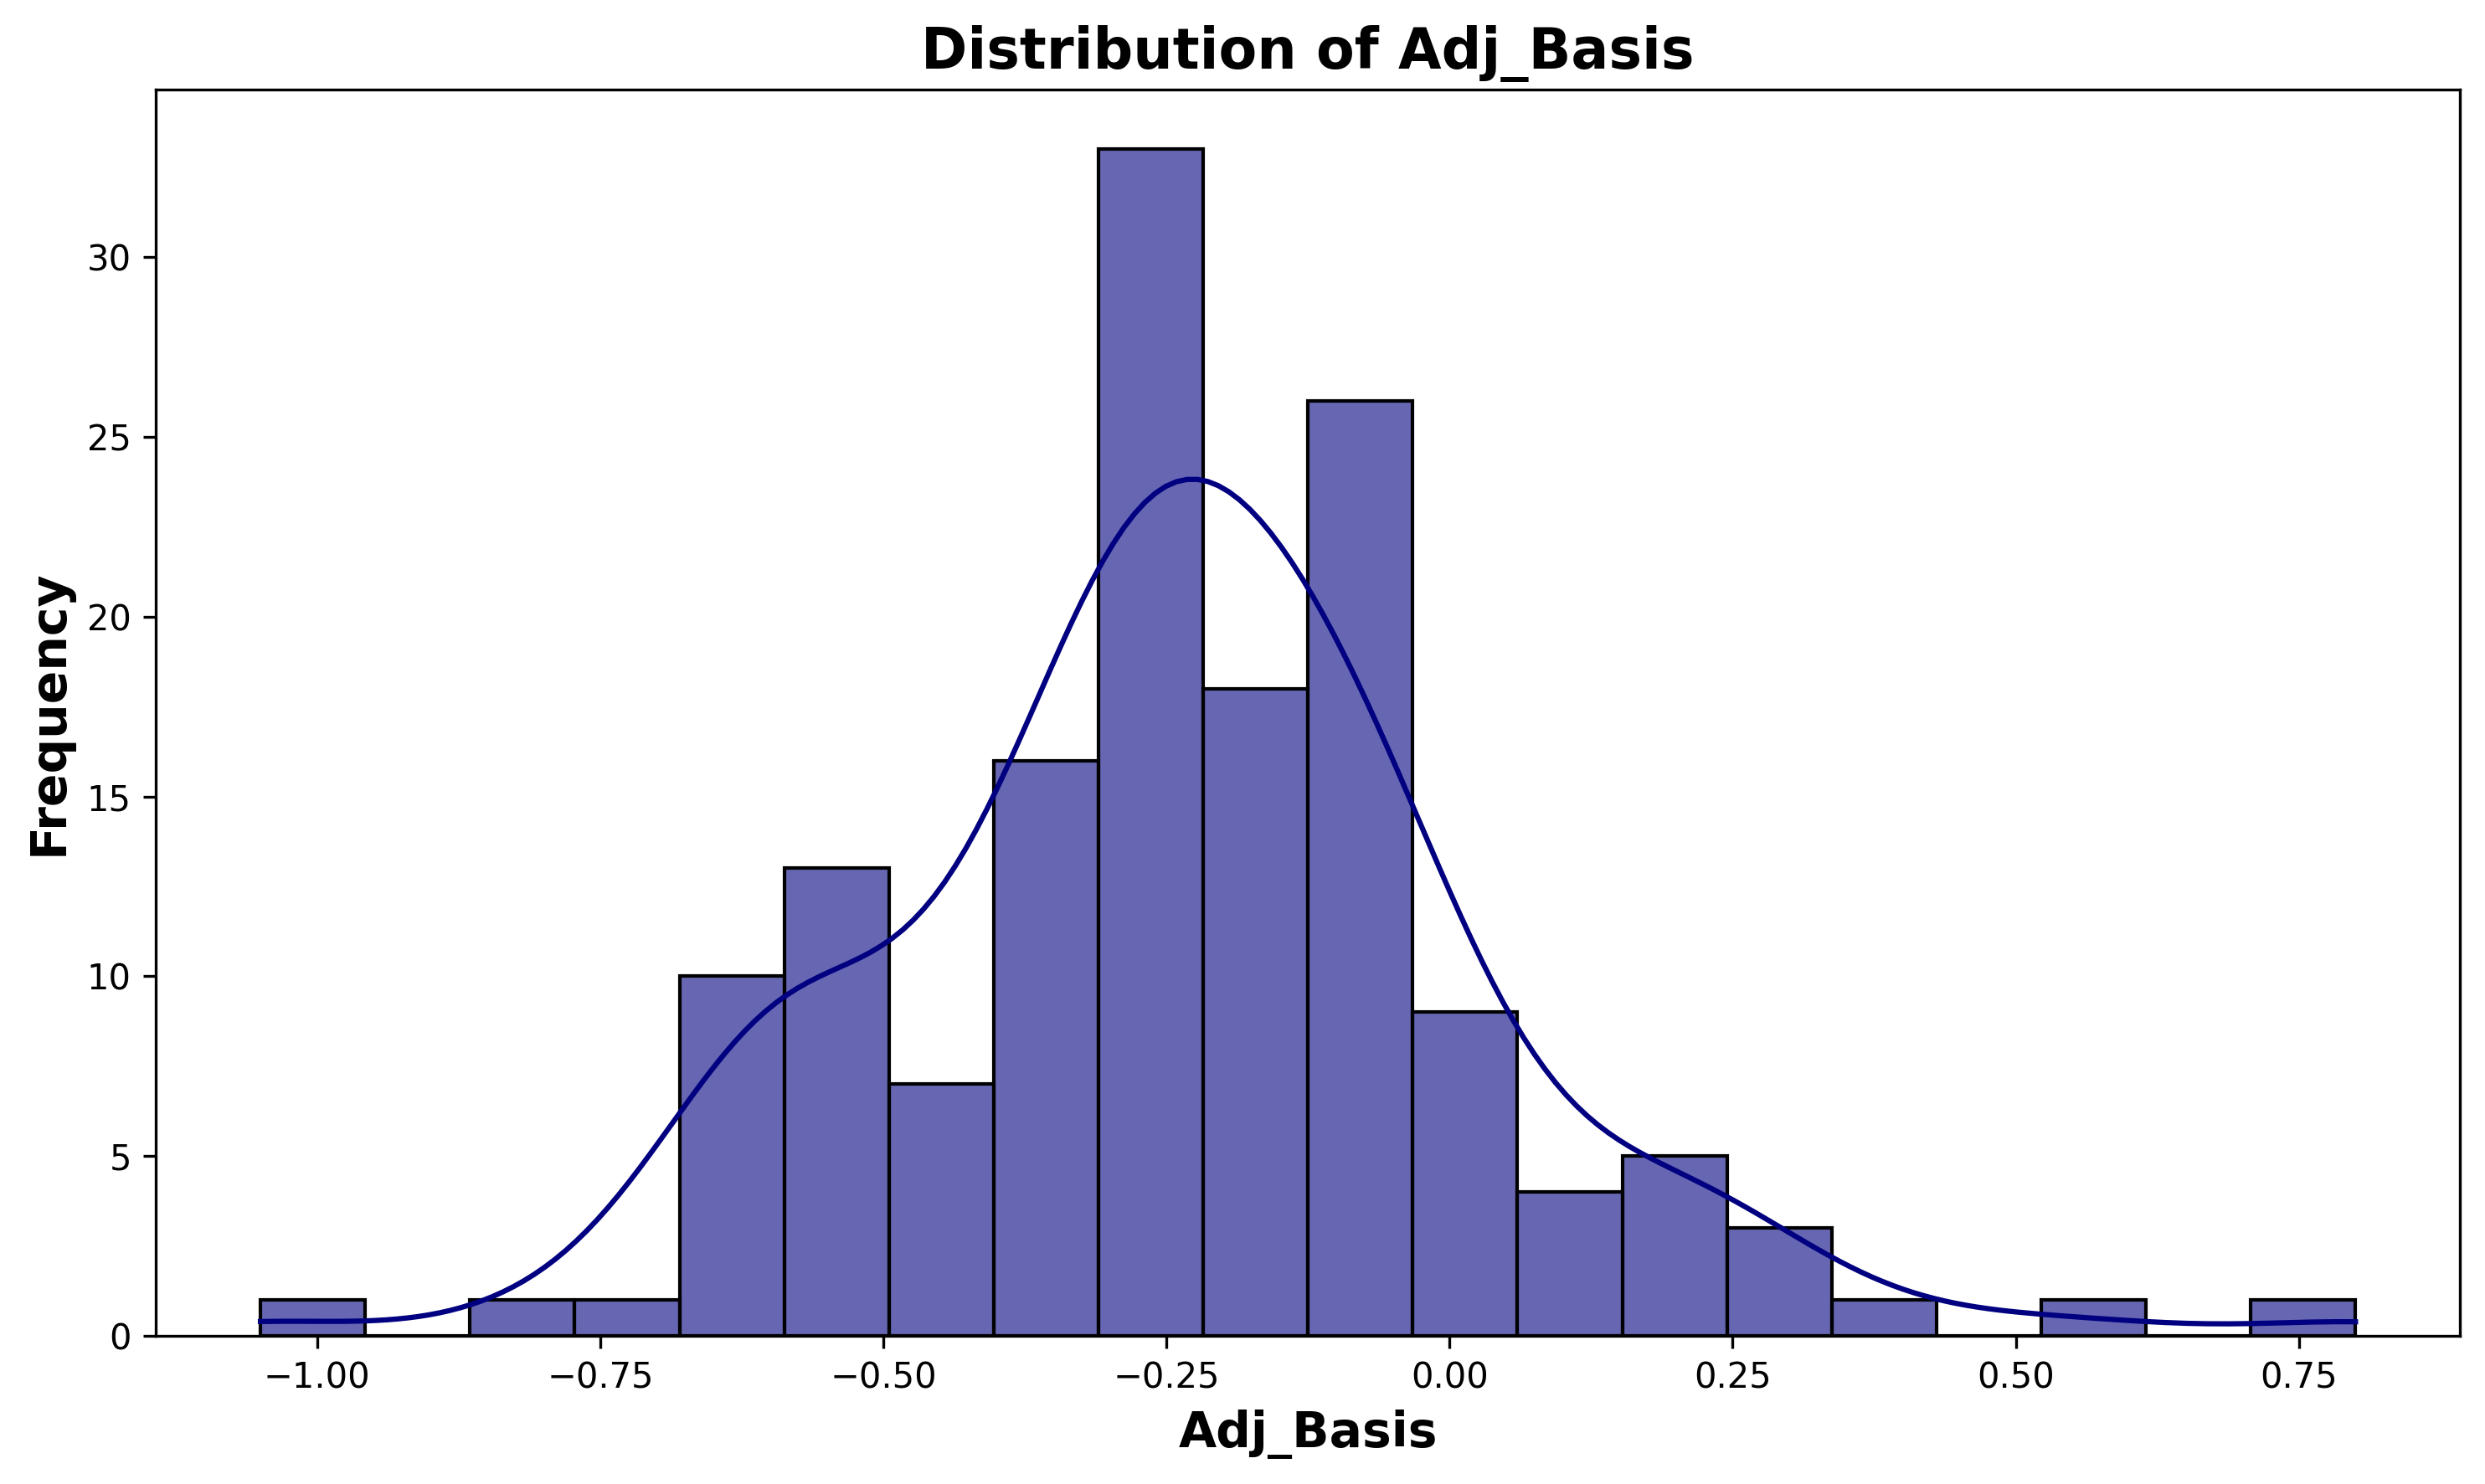
Basis Distribution here>
Corn Ethanol Basis Changes here >
Corn Basis Map One Month ago here >
Corn Basis Map One Year Ago here>
Interested in access to a 4 year archive database of Ethanol corn basis data or specific plant location? Email for more information.
Ethanol Volumes : https://www.eia.gov/petroleum/ethanolcapacity/ethanolcapacity.xlsx
-
Services
Ethanol and renewable technology and optimizations.
-
Ethanol Strategic Development
Develop plans to capitalize on the inherent advantages of a facility including location, rail, quatlity or feedstock
-
Ethanol Yield Optimization
Raise gallons per bushel without blowing up variability.
-
Corn Oil Extraction Improvement
Tune separation, chemistry, and run conditions to lift oil recovery.
-
Fermentation Performance Improvement
Reduce infections, improve attenuation, stabilize run rates.
-
Technology Sourcing & Introductions
Connect with OEMs, FST/MSC providers, and process tech that actually fits your plant.
-
Carbon Intensity Reduction Strategy
Pathway review and recommendations to lower CI and access LCFS/45Z value.
-
Operations Analytics & Statistical Review
Use data to find bottlenecks, off-spec trends, and underperforming assets.
-
Project Delivery & Implementation Support
From business case to commissioning — make the change stick.